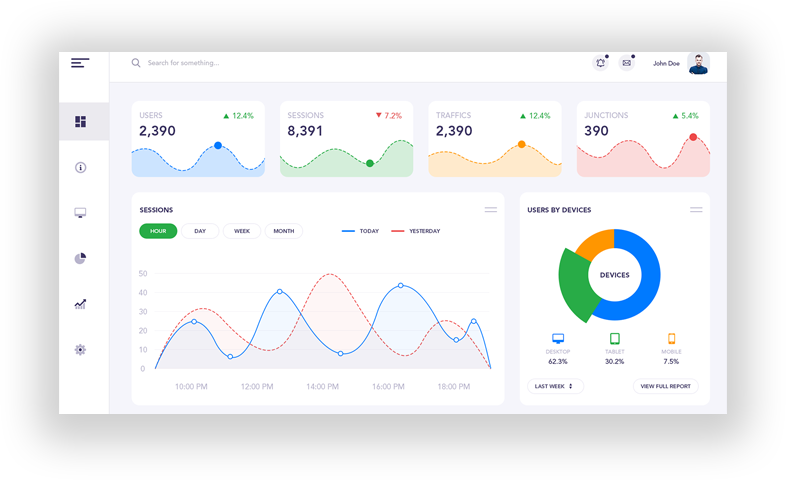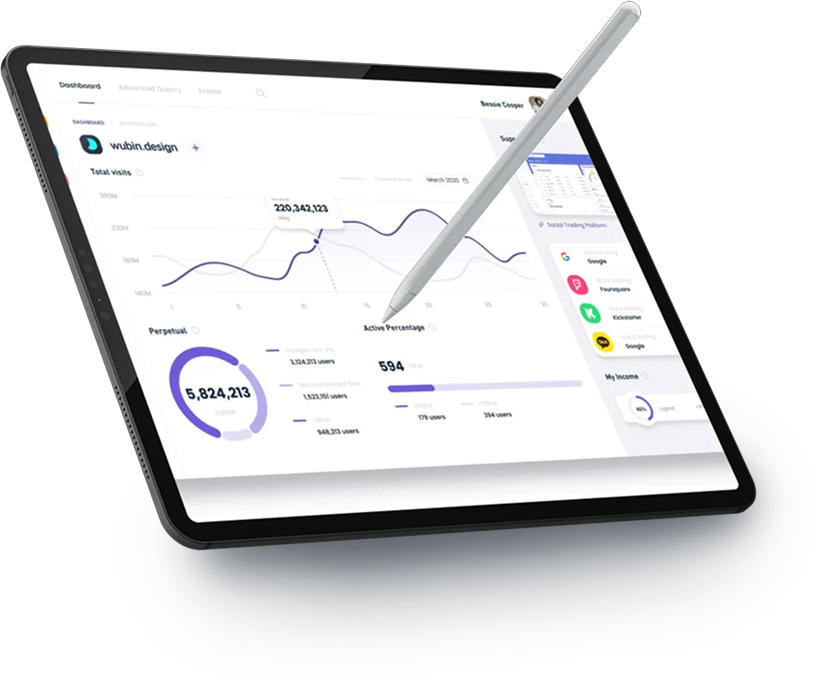
Ensure OTel success with a structured, vendor-neutral roadmap. We assess your SDK coverage, Collector configuration, Alloy/IRM usage, data quality, and backend integrations—then build a clear plan for a scalable, production-ready observability platform.

OpenTelemetry Signal Types
We support core OTel signal types—Traces, Metrics, Logs, Events—to measure coverage, maturity, and pipeline efficiency. Whether you’re using self-hosted backends like Jaeger, Prometheus, or SaaS platforms like Datadog, Splunk, or New Relic, we’ll help format and stream telemetry at scale.
We also help streamline and route telemetry using Grafana Alloy to improve signal quality and reduce noisy data.


Grafana Alloy & IRM Expertise
Compliance & Security Frameworks

Clients Journey
Assessment & Discovery
We review your current OTel setup, SDK coverage, Collector configs, Alloy routing, data quality, and architecture gaps.
Roadmap Design
We build a phased plan detailing what to instrument, how to streamline pipelines, where Alloy/IRM fits in, and how to scale cleanly.
Implementation
We set up SDKs, deploy Collectors, configure Alloy pipelines, and integrate your telemetry with the tools you already use.
Optimization & Enablement
We reduce noise, improve alerts, tune performance, and help your team adopt best practices for long-term success.
Outcomes
Assessment
Inventory, maturity scoring, data sources
Roadmap
Timelines, KPIs, phased rollout strategy
Implementation
Agent setup, config tuning, dashboards, training
Stay Ahead in Observability & Infrastructure Trends
Get exclusive insights on OpenTelemetry, performance tuning, and real-world observability architecture tips—delivered monthly.


